Getting feedback with patron surveys: West Custer County Library
is bottom right (holding Allegiant).
Checking in with patrons is important, whether to measure awareness, satisfaction, or to get input before small or big changes. However, many factors can keep libraries from obtaining that feedback—lack of staff time or experience, for example.
We recently connected with Amy Moulton, Director of the West Custer County Library in Westcliffe, Colorado, about their recent effort at conducting a patron survey. Moulton attended the Research Institute for Public Libraries (RIPL) and applied what she learned to create a patron survey, capture responses and communicate the results.
Although Moulton emphasizes that this was just her second patron survey and she feels like a rookie, she provides an excellent example of how patron surveys can be conducted and communicated. If you are thinking about launching a survey at your library, read on for information and advice.
In addition, you can download the survey questions West Custer County Library asked patrons as well as the infographic report Molton created to illustrate the results.
WebJunction: Can you tell me a little about West Custer County Library and what makes it unique?
Amy Moulton: The West Custer County Library is located in a beautiful rural mountain valley in southern Colorado serving about 4,000 people. We have one full-time and four part-time staff. The library here is a true community center. Along with the grocery store and post office, it's where people go to connect, so it's not a "shhh" place.
High Altitude," taught by two Library Board members.
Our building is just 4,800 sq. ft., which includes a Community Room, but thanks to a shared catalog with over 100 other small libraries in the state—AspenCat—we can get almost any books or movies for our patrons. As the area is mountainous, some people don't have internet at all. Also, some can't afford it. We love offering them the fastest public Wi-Fi in the county and a way for every individual to stay connected to the world and current resources.
One of the unique things about our library is the warm, family atmosphere. Sometimes it feels a little like the show Cheers. The area has a large retiree population, so we have a vast pool of experts who can teach just about anything from sushi making to astrophysics to laughter yoga.
Another unique program we just started allows jobseekers to save time and money by reserving our Community Room and a device so they can Skype in private with an employment specialist at the nearest Workforce Center, located an hour away in Canon City, Colorado. They can get assistance in job searches, veteran employment assistance, resume preparation guidance or enroll in employment training programs.
WJ: What was the need for a survey, and what were you hoping to capture or find out?
AM: The library creates a long-range plan every three years, so the patron survey was the first step in gathering data to inform that plan. Also, the data helps us with short-term decisions like when to schedule events and assists us in evaluating the effectiveness of our marketing. The library has done patron surveys in the past, but this survey was completely different thanks to what I learned at the Research Institute for Public Libraries (RIPL) last year. Using an infographic to inform our staff and board, and now the public, is also new.
WJ: How did you collect results and what was the breakdown of how people took the survey?
AM: 115 people took the survey. Of those, 41 people (or about 36%) filled out a paper survey in the library. The remaining used some kind of digital method via SurveyMonkey:
20 people used the iPad in the library
43 people accessed it through a Facebook link (posted three times and shared on a community Facebook page)
6 people accessed it through our website
5 people accessed it through our eblast
SurveyMonkey allows you to create a different link or "survey collector" for each source, which gave us that data.
WJ: Were you happy with the response?
AM: We were pretty pleased with 115 responses from various ages and backgrounds. This time, I used chocolate as the motivator. Whenever I posted or marketed the survey, I used a photo of chocolate to grab their attention. You would be amazed how many people took the survey online and then stopped by for their little piece of chocolate!
The last time I did a patron survey, we had a drawing among the participants for three e-readers and received about 140 responses. I wanted to keep this survey inexpensive and somewhat low key because we are planning on doing a community needs assessment in the fall in partnership with many of the area service organizations and entities. I wanted to save our prize budget for that and not over-publicize this one so people wouldn’t think, "Oh, great. Another survey."
A community needs assessment is very different from a patron survey. The patron survey asks people who already use the library how we're doing and what we could do better. A community needs assessment pulls the library out of the picture altogether and asks everyone in the community about their needs. We pass the results of the assessment to the appropriate organizations to meet those needs. This also helps bypass stereotypes about the library.
WJ: Were there any questions in hindsight you wish you had asked?
AM: Not at this point. We discussed and determined the information we needed to know first and then removed any questions that could be answered through other sources (past program-specific surveys, our ILS, local census data, etc.). For example, we already had data on what days and times teens preferred to attend library programs, so we didn’t need to ask again. We then tested the survey on staff and the library board to look for clarity issues. After making some improvements, we tested it on a few patrons. By the time the survey was launched, it was pretty tight.
WJ: Have you used Piktochart before? Would you recommend this to others?
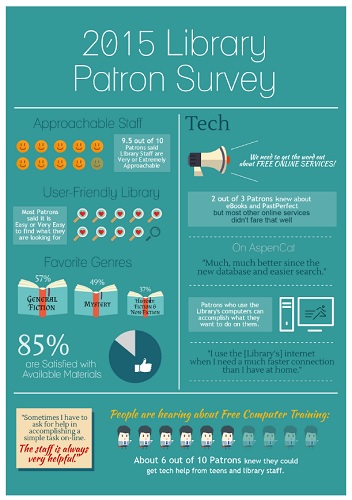
AM: I loved Piktochart. It's free for what I did, and they have a lot of graphics and graph options. They let you layer graphics, so most of my visuals use more than one graphic or a graphic on top of a graph. This was my first infographic, so the hardest part was translating the lengthy data into something meaningful people can understand at a glance. Also, I tested it with several people and made a lot of changes due to that, like adding percentage labels to the "Best Way to Promote Events" graph.
WJ: Any advice you would give to libraries who are perhaps looking to conduct a survey for the first time (or the first time in a long time)?
AM: 1) Determine who you are trying to inform and talk to them to find out what information they need or want. Consider what data you would like to compare in future surveys. Would any data also help with upcoming grant requests?
2) Connect with someone who is experienced to learn how to write effective, non-leading questions and gather some survey examples and infographics. A fantastic resource is Colorado's Library Research Service, which has library user survey templates and how-tos.
3) Test the heck out of your survey! An unclear question can confuse and frustrate your participants. You want them to have a smooth, easy experience so they'll finish it. Also, a leading question will give you inaccurate results. I would recommend joining the PL-EVAL mailing list, which is all about public library data and evaluation. They may be able to provide more survey samples and assist with vetting your survey questions.
4) Use multiple methods for delivering the survey. I find a digital survey to be fastest and easiest to promote, but we have patrons who we knew would only take it using paper. We placed a small table and a couple of chairs by the front desk with the paper surveys, the iPad survey, a big glass jar of chocolate and a simple sign with a big Hershey's Kisses graphic. Having someone regularly ask patrons to take the survey might have been more effective, but we didn't have the staff for that, so the front desk staff just mentioned it when they had time.
5) Use an infographic to communicate the data for your target audiences. It is so much more effective than trying to get people to read pages of charts and graphs. Also, it can serve as a translator, telling them what the data means to them.
6) Bribery is a beautiful thing (in this case). We all are inundated with survey requests and so are our patrons. Giving them a little something or a chance at a big something might just make the difference between them taking or not taking the survey. I use Hershey's Kisses to motivate adults to take a very short survey after adult library programs, and even if the event is about chocolate and they've just eaten a bunch of it, they'll still fill out a survey to get another piece.
WJ: Anything else you'd like to add?
AM: I want to thank the people at the RIPL for transforming the way I collect, measure and communicate library data.
Want to learn more about conducting surveys at your library? View the archived webinar Library Surveys for Success on WebJunction.